Your dashboard, rebuilt
Starting today your dashboard is one Settings page with eleven tabs that answer at once, with usage by model and API key, plus latency and first-token times for your requests.
When a bill or a slow response raises a question, the answer is one click away: open the request in Logs to see latency, time to first token, tokens by kind with their cost, and the request ID your client already received. Your account is now one Settings page whose tabs answer a click at once, and a panel whose data fails to load says so instead of showing a zero.
Every request, with the numbers that explain it
Logs lists each request and each billing event. Open a row and the drawer answers the questions a bill or a slow response raises:
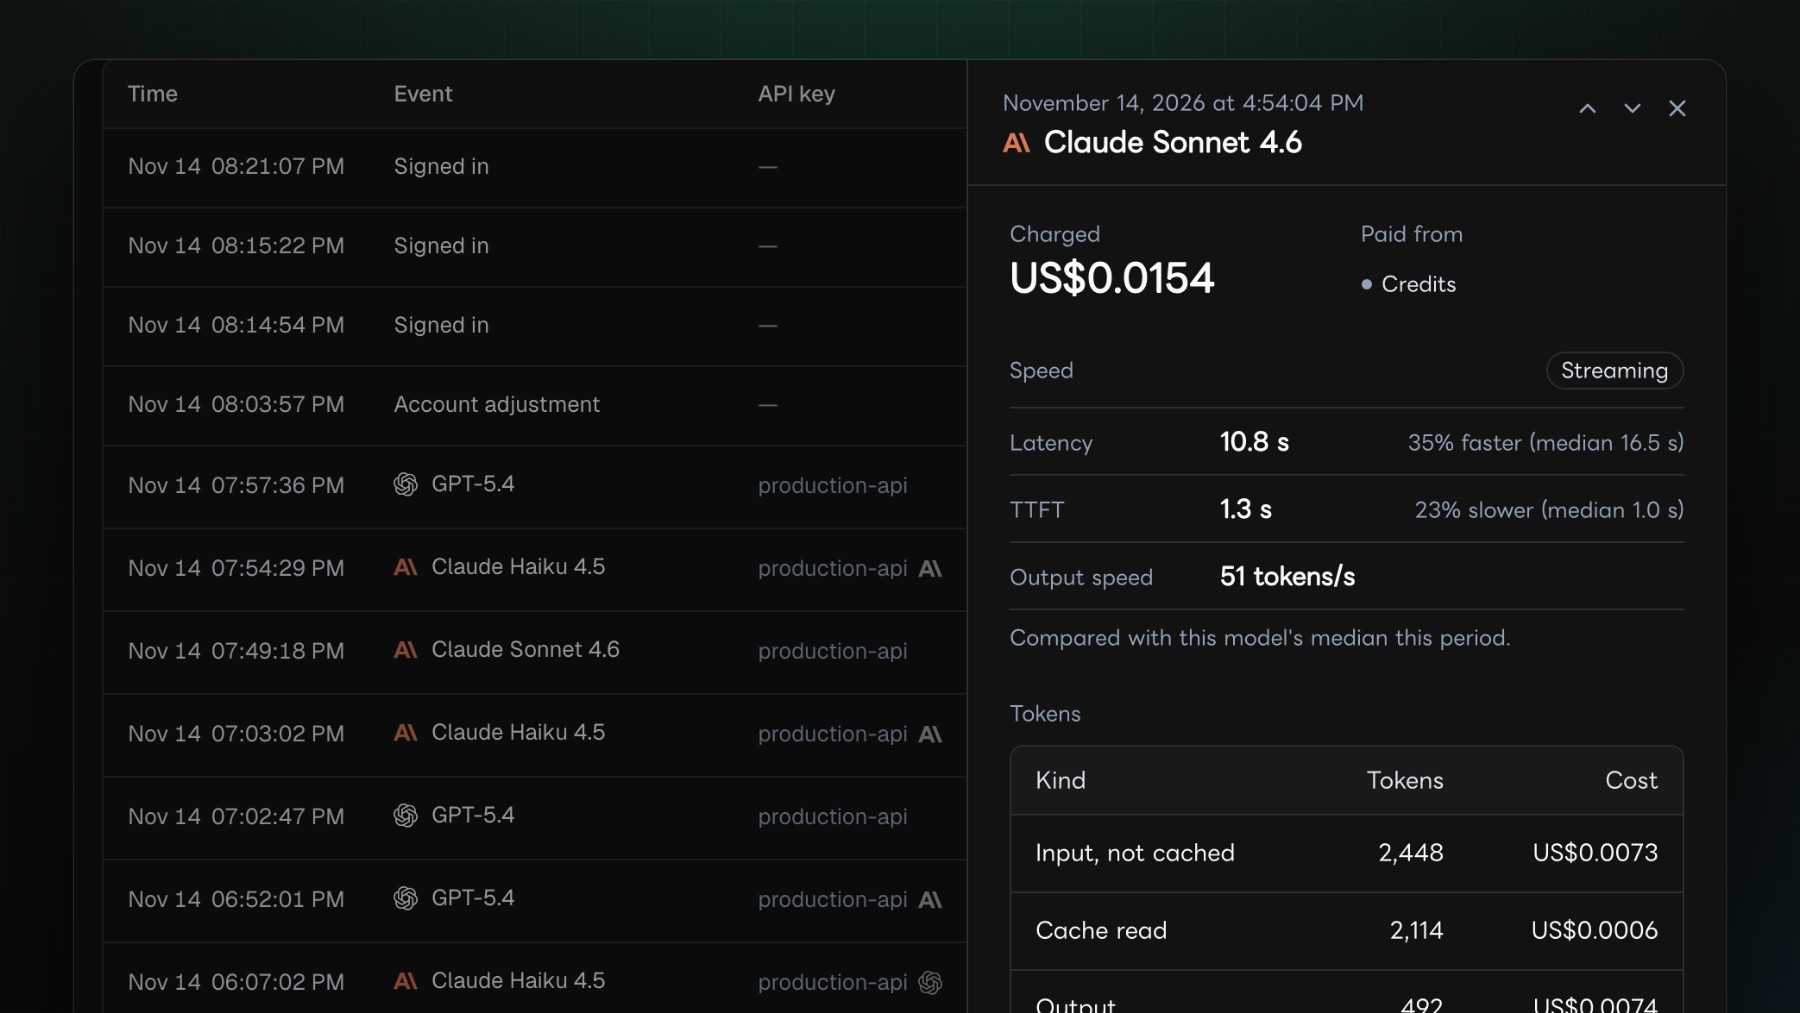
| Field | What it tells you |
|---|---|
| Charged, Paid from | the amount, and whether it came out of included plan quota, on-demand credit or credits |
| Latency | total time of the request, beside this model's median for the period: "35% faster (median 16.5 s)" |
| TTFT | time to first token, counting reasoning, for a streamed response, with the same comparison |
| Output speed | tokens per second, for a streamed response |
| Tokens by kind | input that was not cached, cache read, cache write, output and reasoning tokens, and the share of the input that was read from the cache |
| Cost per kind | shown when the catalogue prices every kind the request used: the charge split in proportion to list prices. The total is always what was charged |
| Stopped because | the finish reason in words: it finished, it hit the length limit, it called a tool |
| Plan multiplier | on a subscription request, the multiplier the plan applies to this model |
| Application | the client that sent the request |
| Request ID | the id your client received, and the one to quote to support |
The request ID is the one your client already has. Every API response carries it in the X-Apertis-Request-Id header:
curl -si https://api.apertis.ai/v1/chat/completions \
  -H "Authorization: Bearer $APERTIS_API_KEY" \
  -H "Content-Type: application/json" \
  -d '{"model":"gpt-5.4","messages":[{"role":"user","content":"ping"}]}' \
  | grep -i x-apertis-request-id
Log that header in your application and you can paste it into the Logs search box to land on the exact request: its model, tokens, cost and timing.
Other details that save time:
- Every filter lives in the URL. Range, comparison, interval, model, key, payer, event and search are query parameters, so a filtered view can be bookmarked or sent to a teammate, and it survives a reload. An open row is linkable too.
- Keyboard.
jandk, or the arrow keys, walk through rows without closing the drawer. - Filter by API key to see what one key did, by who paid to separate included quota from on-demand spend, and by application.
See latency and first-token time, per model and per day
Above the list, the overview charts the same window by credits, requests, latency or TTFT, and compares it with the previous period or the same days last month.
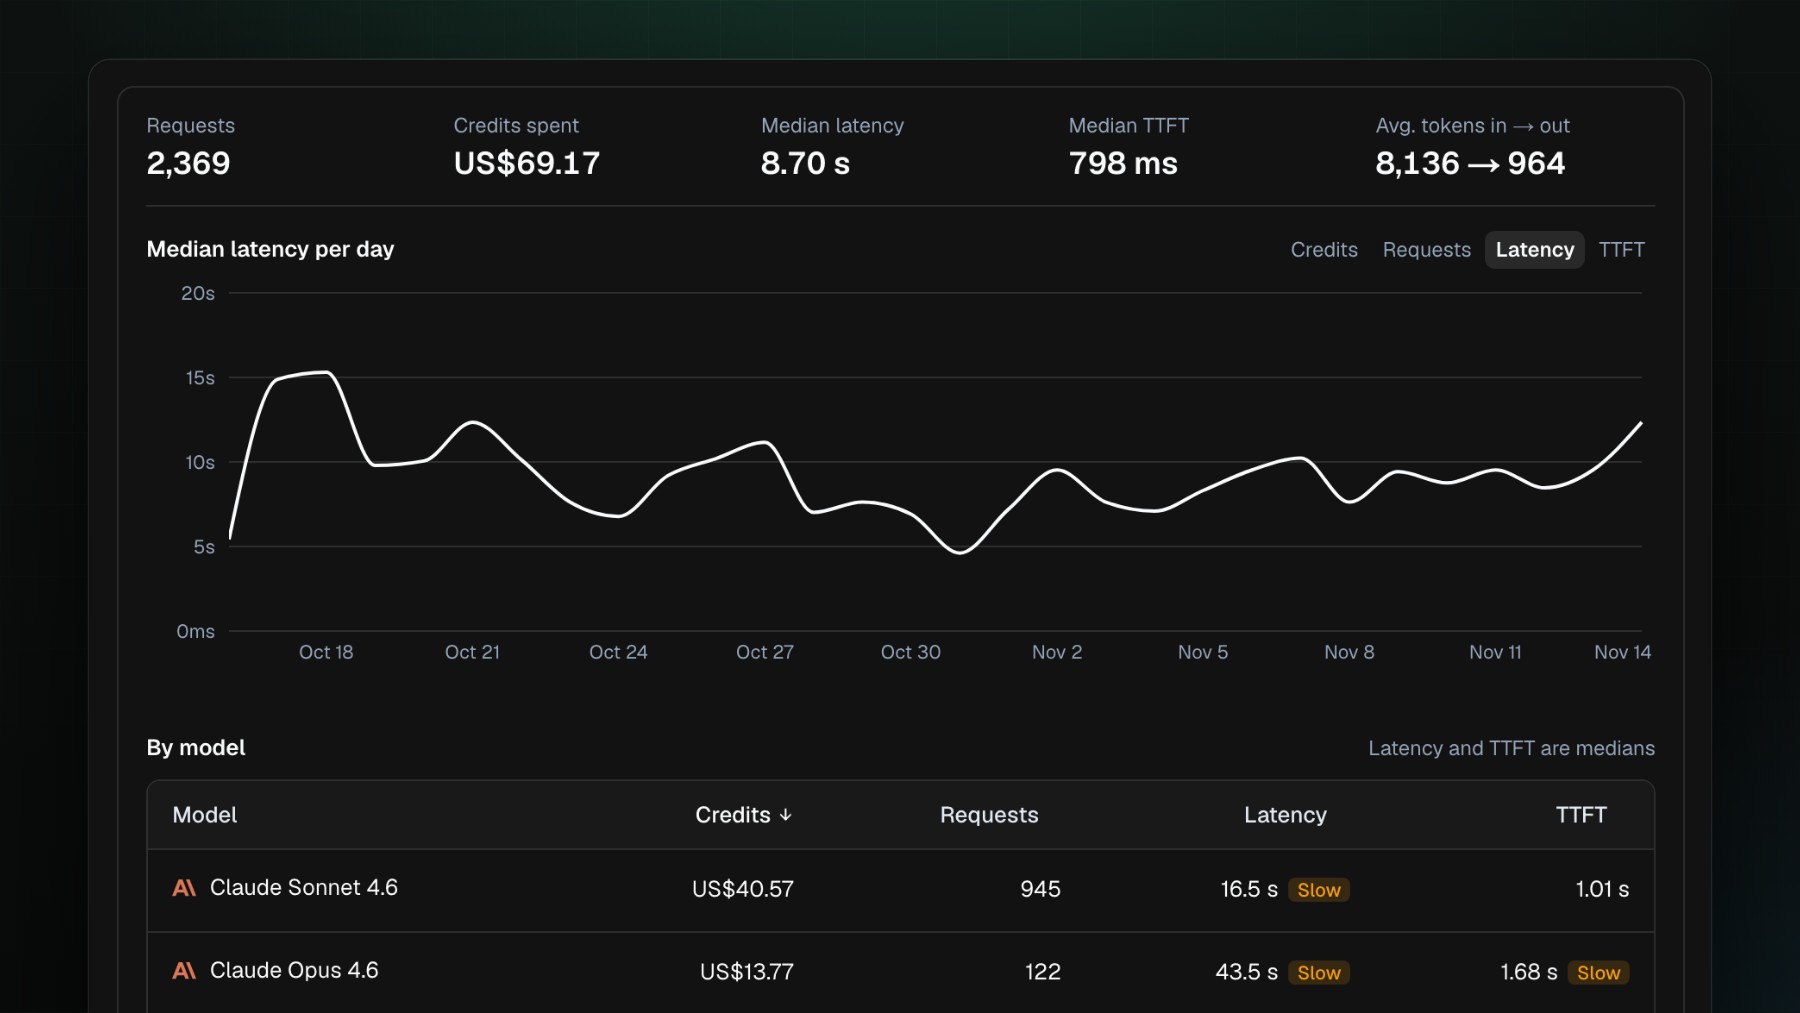
You can show latency and TTFT as an average or a median. The median is read from a histogram of every request in the window, not from a sample, so one slow outlier does not move it. Bars can be hourly for a window of a day or two, and daily or weekly beyond that.
Read your usage and limits
Usage & Limits shows what you used and what you were charged.
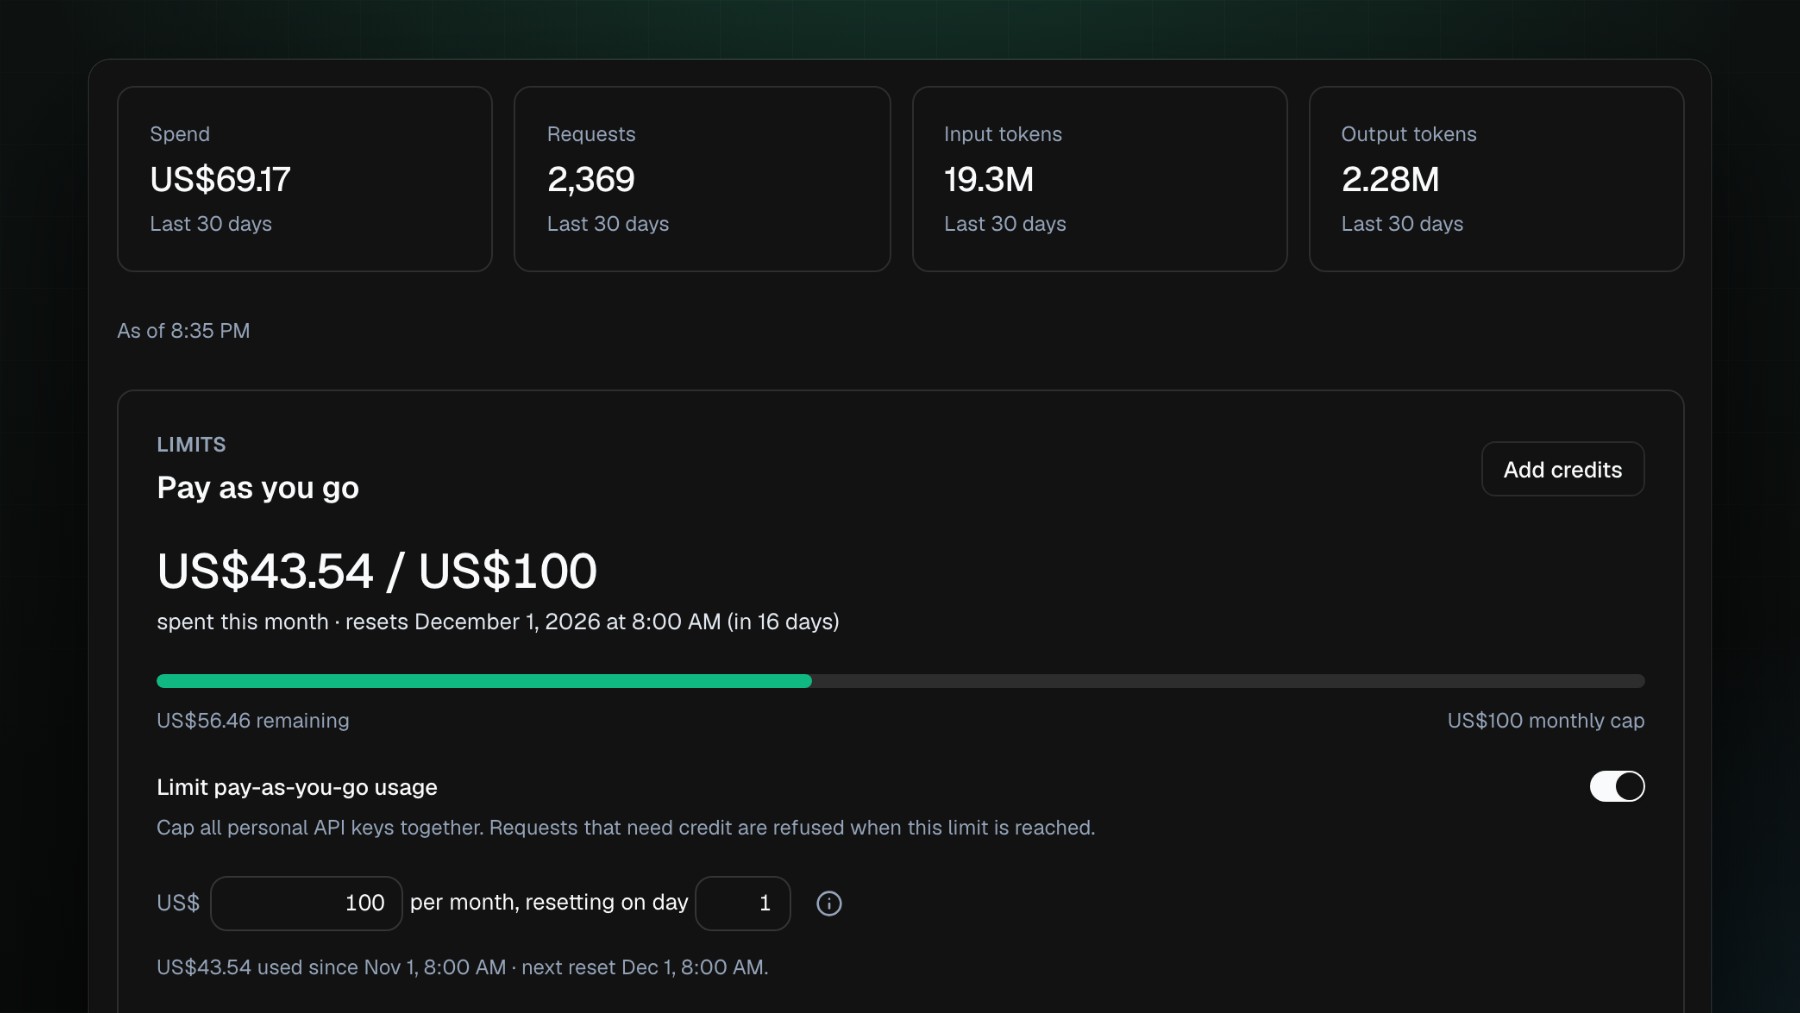
- Ranges: the last 7, 30 or 90 days, or a custom range inside the last 90 days.
- Spend is what you were charged, not a list-price estimate. A plan account sees included quota and on-demand credit as separate meters.
- Model Usages sorts by spend, requests, input or output tokens, with a provider filter.
- CSV export returns one row per model per day:
date,model_id,model_name,provider,requests,quota,spend_usd(1 USD is 1,000,000 quota units). - Fresh without waiting. The usage read is keyed to a version that moves with every request you make, so a request you just sent shows up on the next view, not after a cache timer.
A failed read says so
A dashboard that draws $0 when its data failed to load is worse than no dashboard: the zero looks like real usage. Each panel now has three distinct states: loading, loaded, and failed.
| When a read fails | What you see |
|---|---|
| Usage, on Overview and Usage & Limits | "Usage couldn't be loaded." with Retry and a request ID |
| Balance, plan, logs, credits | that panel's own message; the other panels stay usable |
| Too many requests | "Too many requests in a short time" |
| After you change a setting | the last good value stays on screen until a newer one replaces it |
| CSV export | an error response, never an empty file that looks like a month with no usage |
One page, and it answers at once
Everything about your account is at apertis.ai/setting: Overview, Usage & Limits, Activity, Logs, API Keys, Credits, Billing, Preferences, Security, Subscription and Plan Models.
A tab click no longer waits for data. The page frame and the tab's own structure draw first and the numbers stream in. In our test rig, with 300 ms added to every API call, the first visible change after a click went from 651 to 1,031 ms down to 3 to 9 ms. Returning to a tab within 30 seconds redraws it with no request at all; after that, one small version check decides whether anything needs refetching.
Old links keep working:
| Old URL | Now opens |
|---|---|
/token | Settings, API Keys |
/token/edit/<id> | API Keys, with that key open |
/topup | Credits |
/log | Logs |
/subscription-dashboard | Subscription, or Plan Models |
/user/edit | Overview |
A signed-out visitor is sent to sign in and returned to the same tab with the same filters.